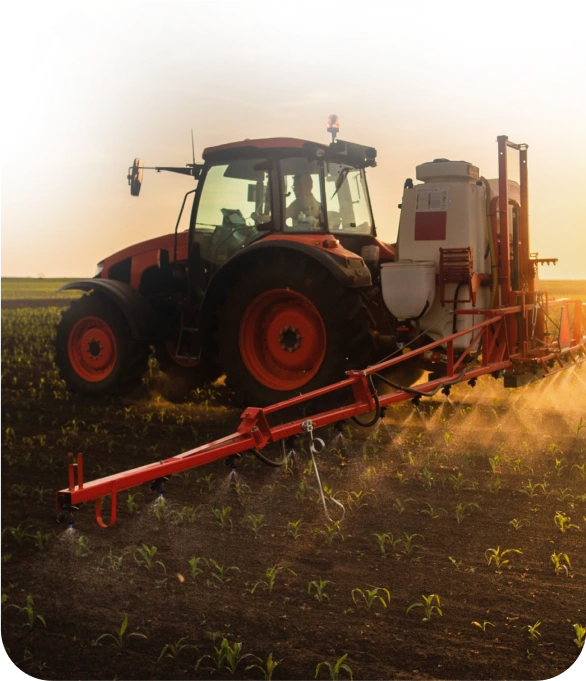
Best farming tools in one place
Professional tools -
at your fingertips
at your fingertips
Receive, upload and analyze all field-zone specific information in one place: from weather forecasts to historical data, from current biomass to the condition of your soils.
The bundle of tools you get with xarvio FIELD MANAGER:
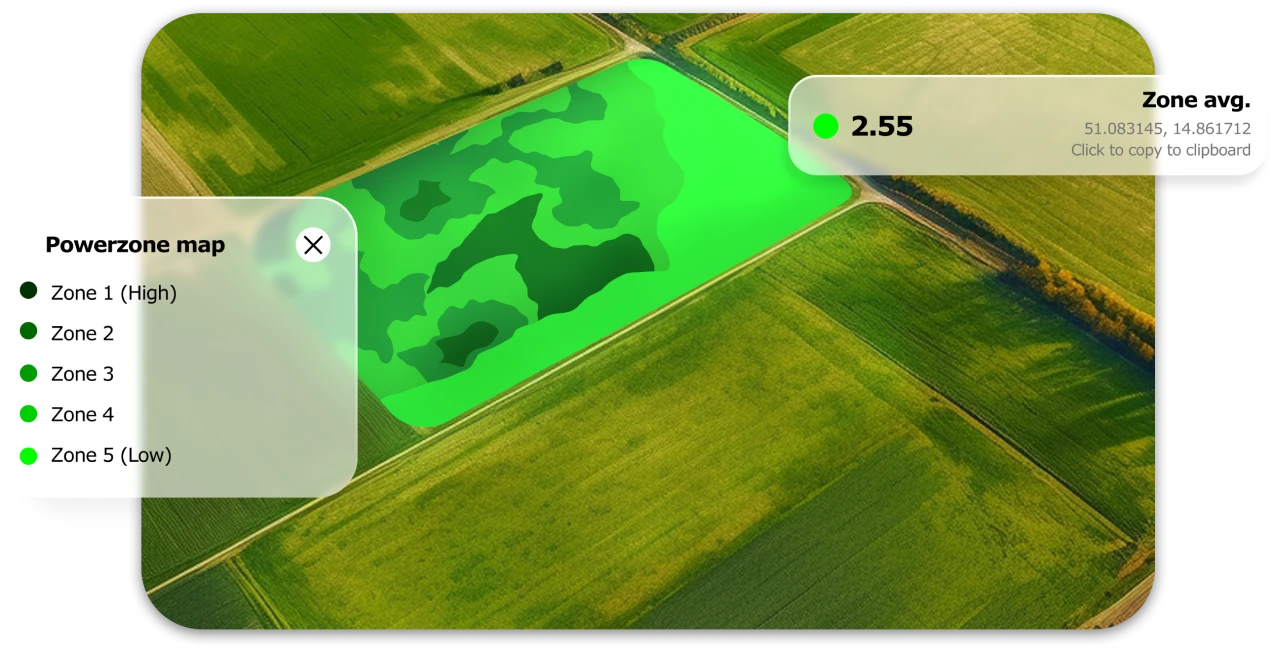
Current Biomass Maps
and Satellite Images
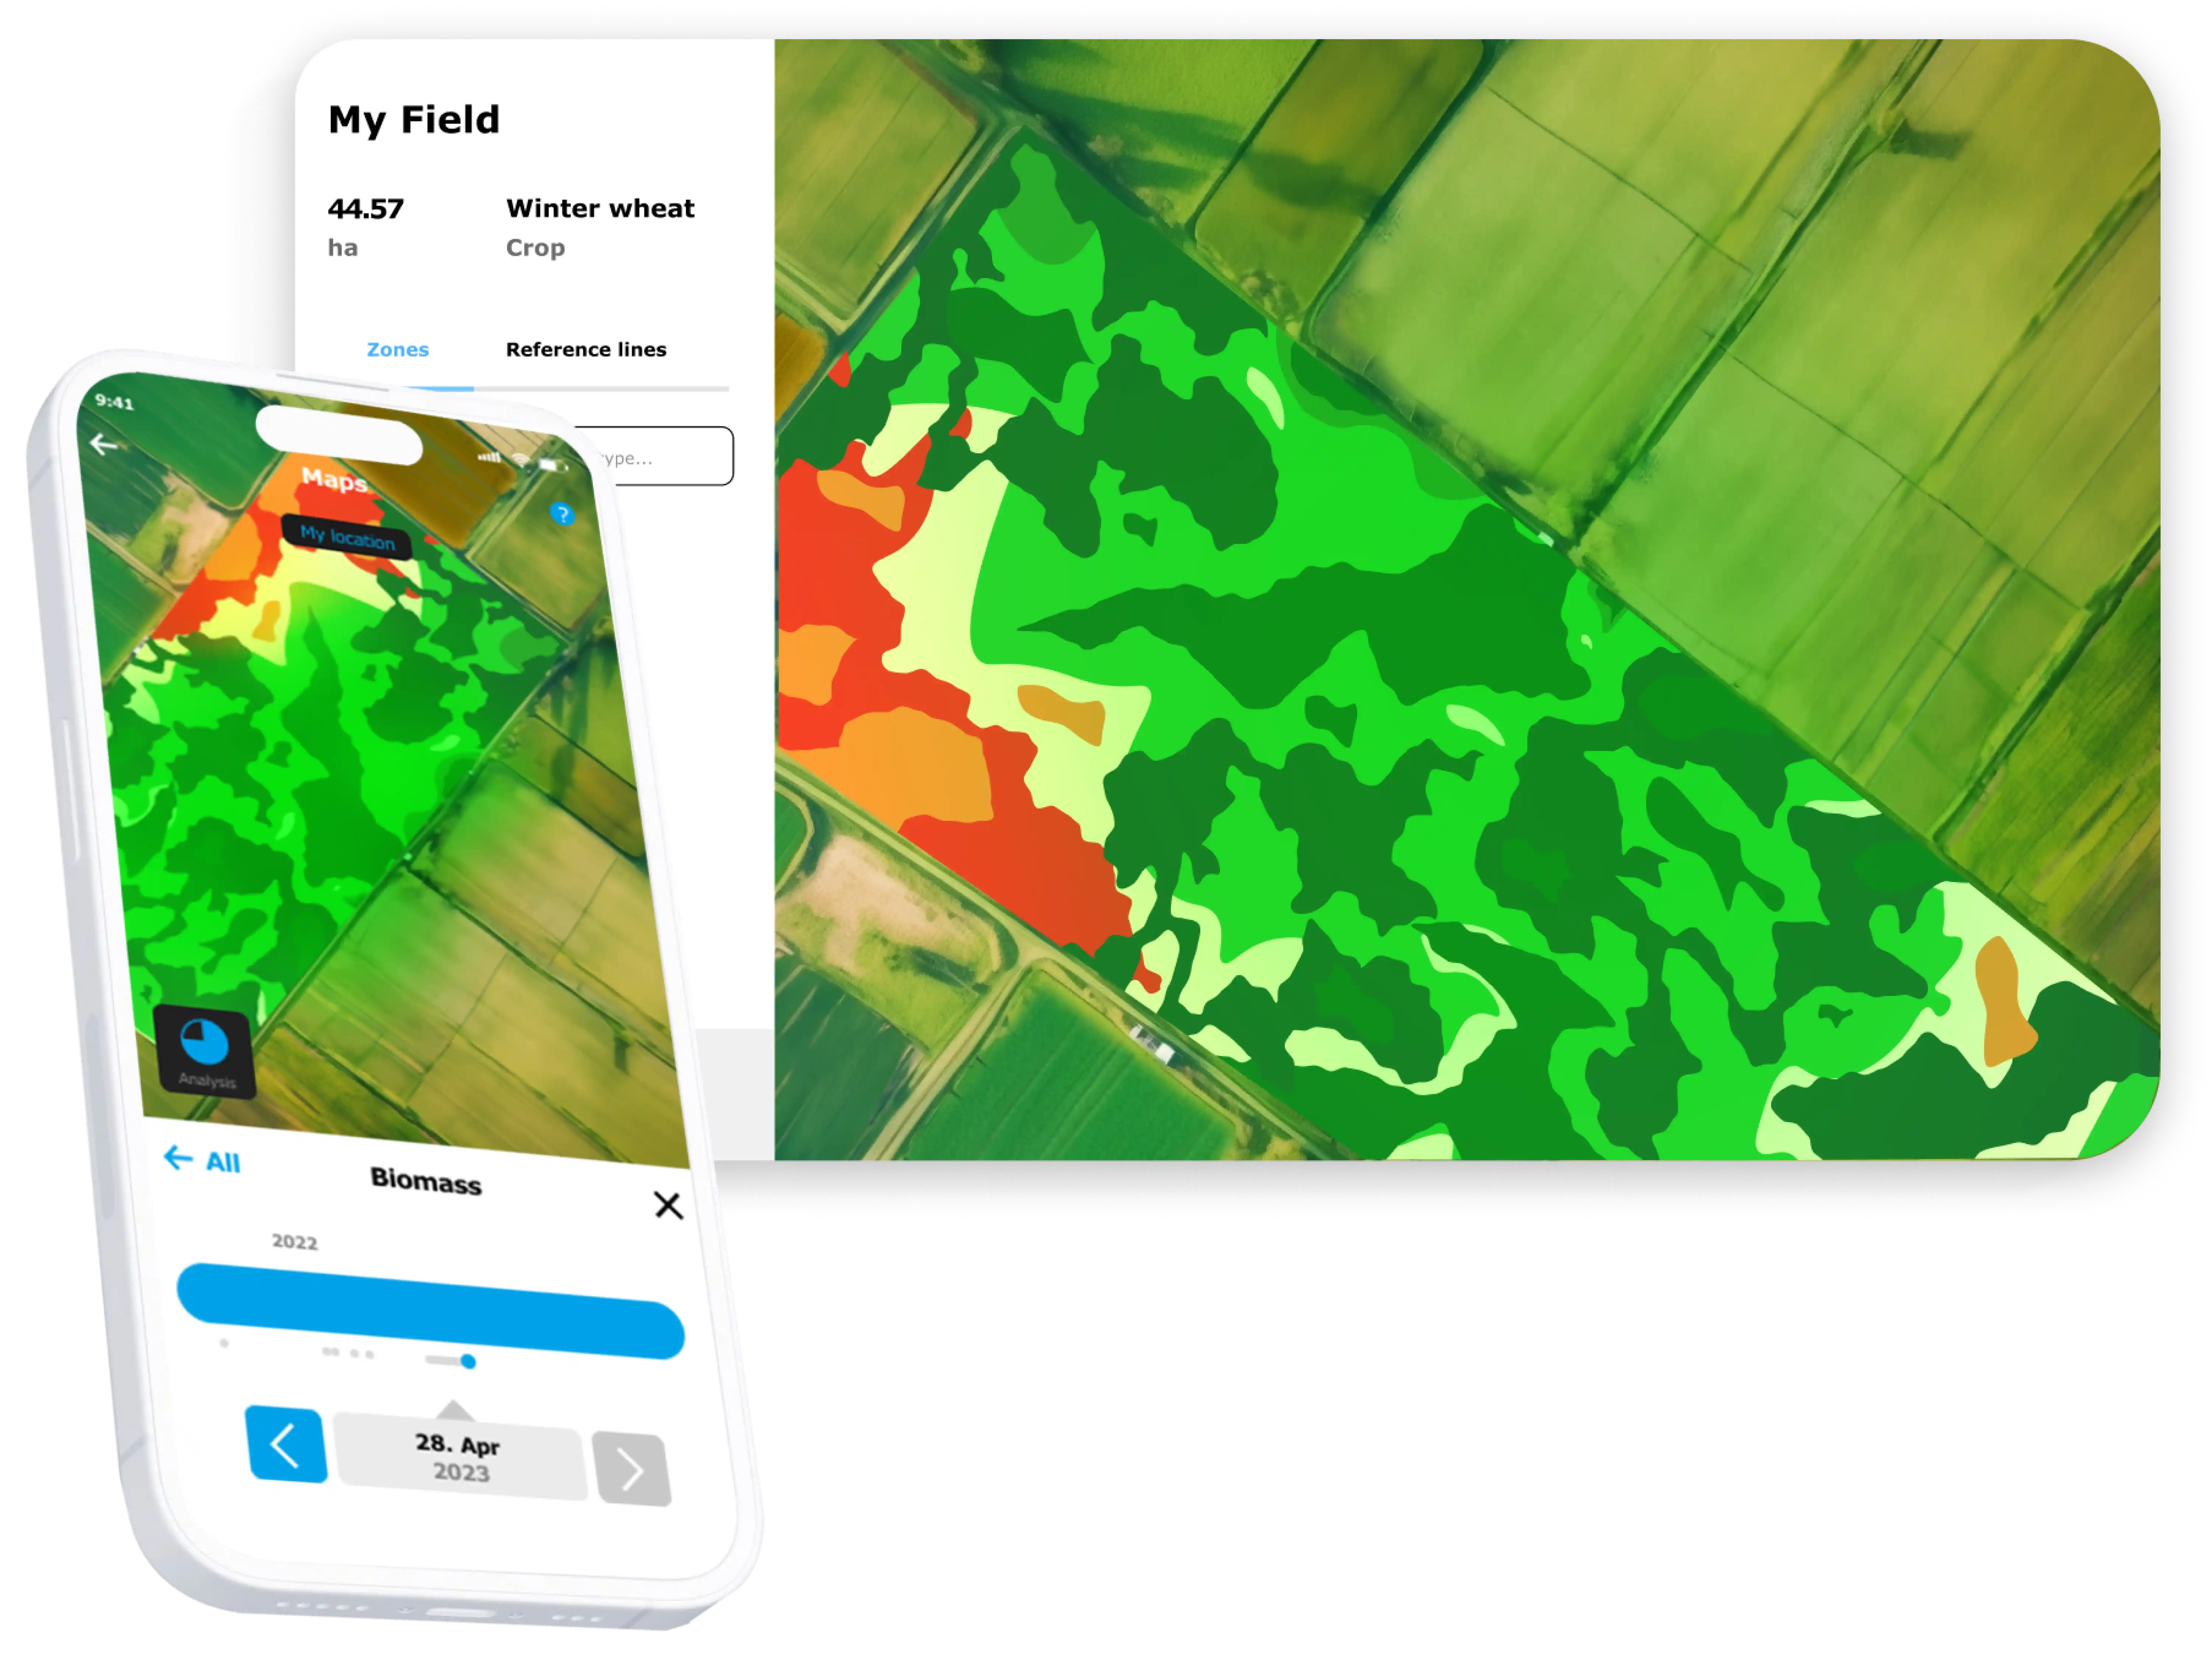
Identify high & low performing field-zones based on current satellite data:
- Compare maps of different field at any time, including maps from previous years
- Receive relative biomass maps every 3 days to visually compare differences in an individual field.
- Use biomass maps to make better-informed decisions for crop production.
- Benefit from updated information on the success of field management activities.
- Identify issues in the fields early and prioritize your scouting activities.
Historical yield potential maps
Assess the yield potential for each field zone based on 15 years of historic biomass data:
- Before Season: Use the historical biomass map to plan seeding and field preparations.
- In-Season: Utilize historic biomass data for fertilizer application.
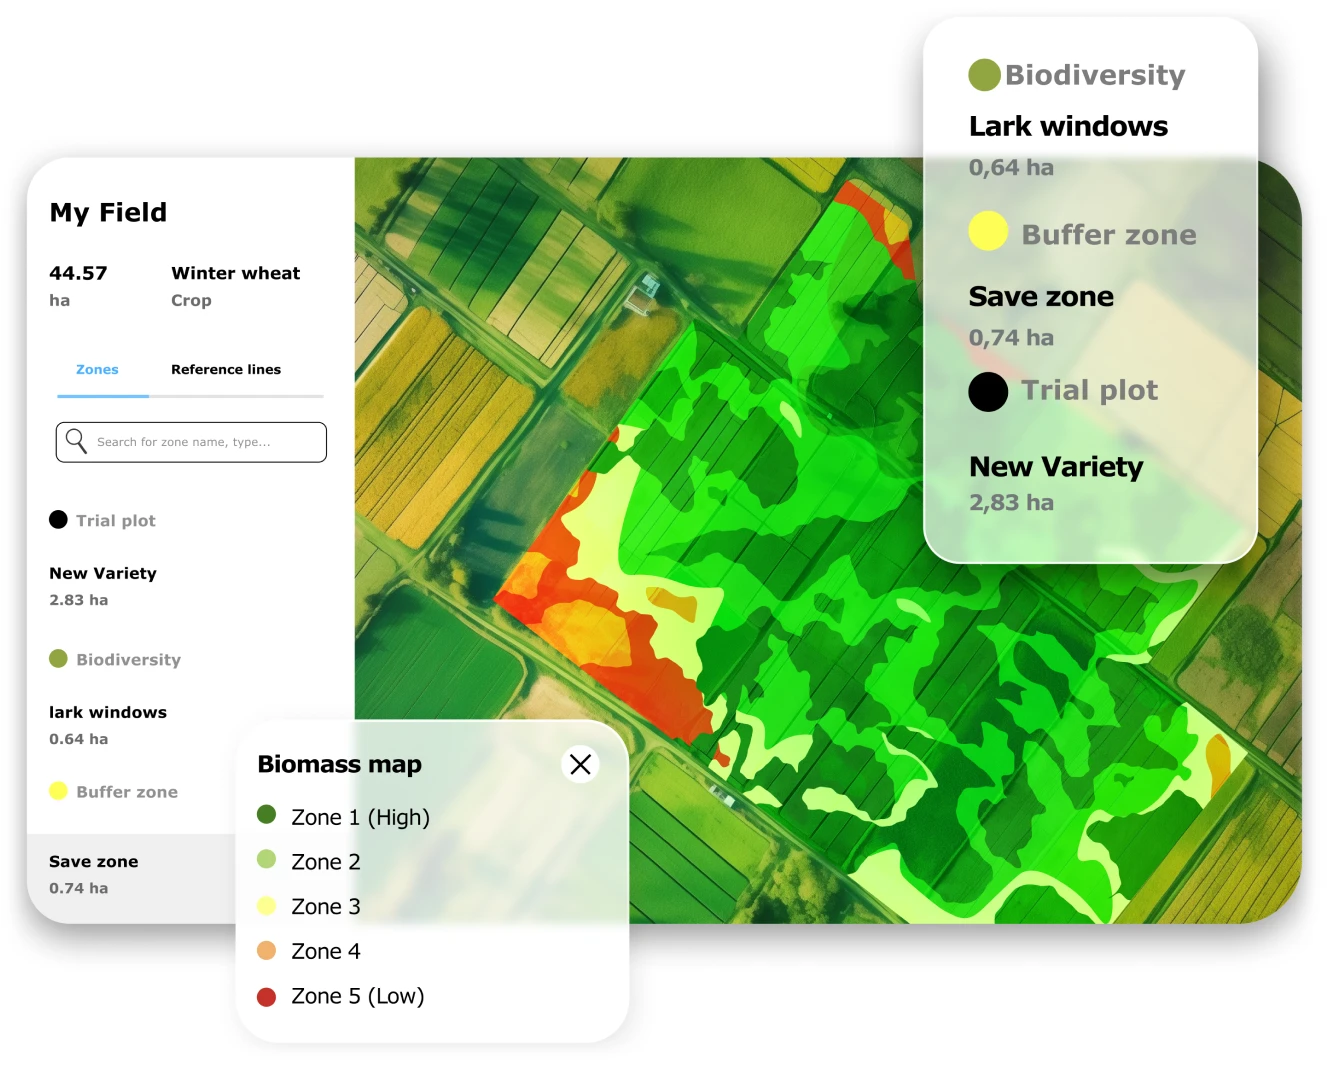
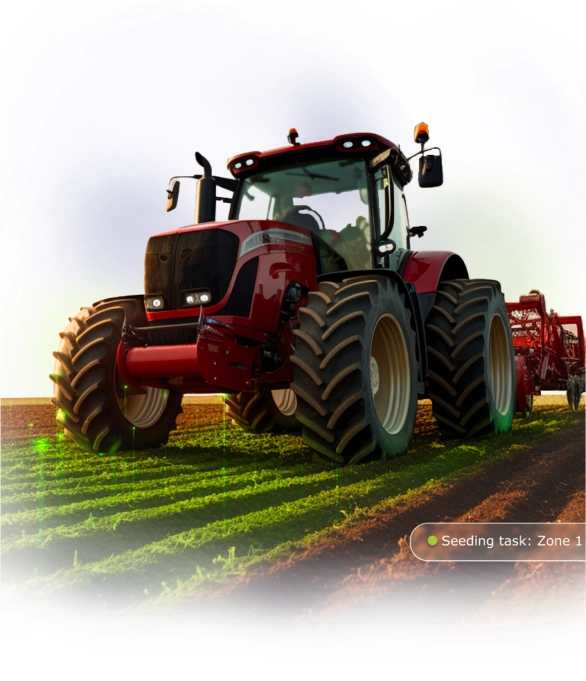
Management zones
Set-up field management zones for individual fields, permanently or season specific:
- Identify the right place for management zones using different information layers in the background
- Historic & current biomass
- Soil maps
- Yield maps
- Categorize them and manage them accordingly
- Buffer & biodiversity zones, e.g. flowering stripes
- Trial plots
- Field obstacles
- Upload or send the management zone maps to terminal for automatic on-field implementation
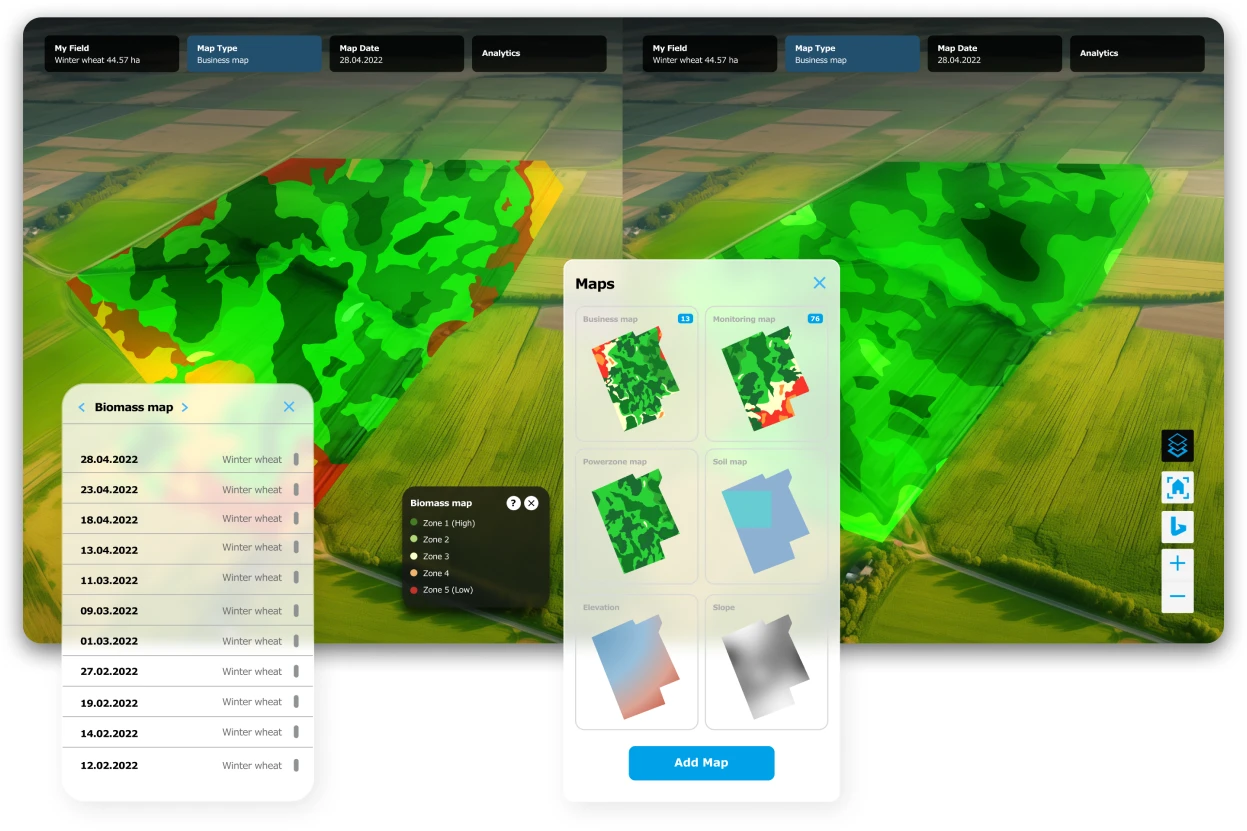
Field Analytics
One place to monitor, compare and analyze field zone information all year long:
- Compare different maps to better understand field characteristics and agronomic potential.
- Monitor crop performance during and across seasons.
- Optimize crop production by analyzing the results of different field management strategies.
- Upload and visualize yield maps to analyze application performance and harvest.
- Upload and visualize soil maps from the fields to plan targeted actions.
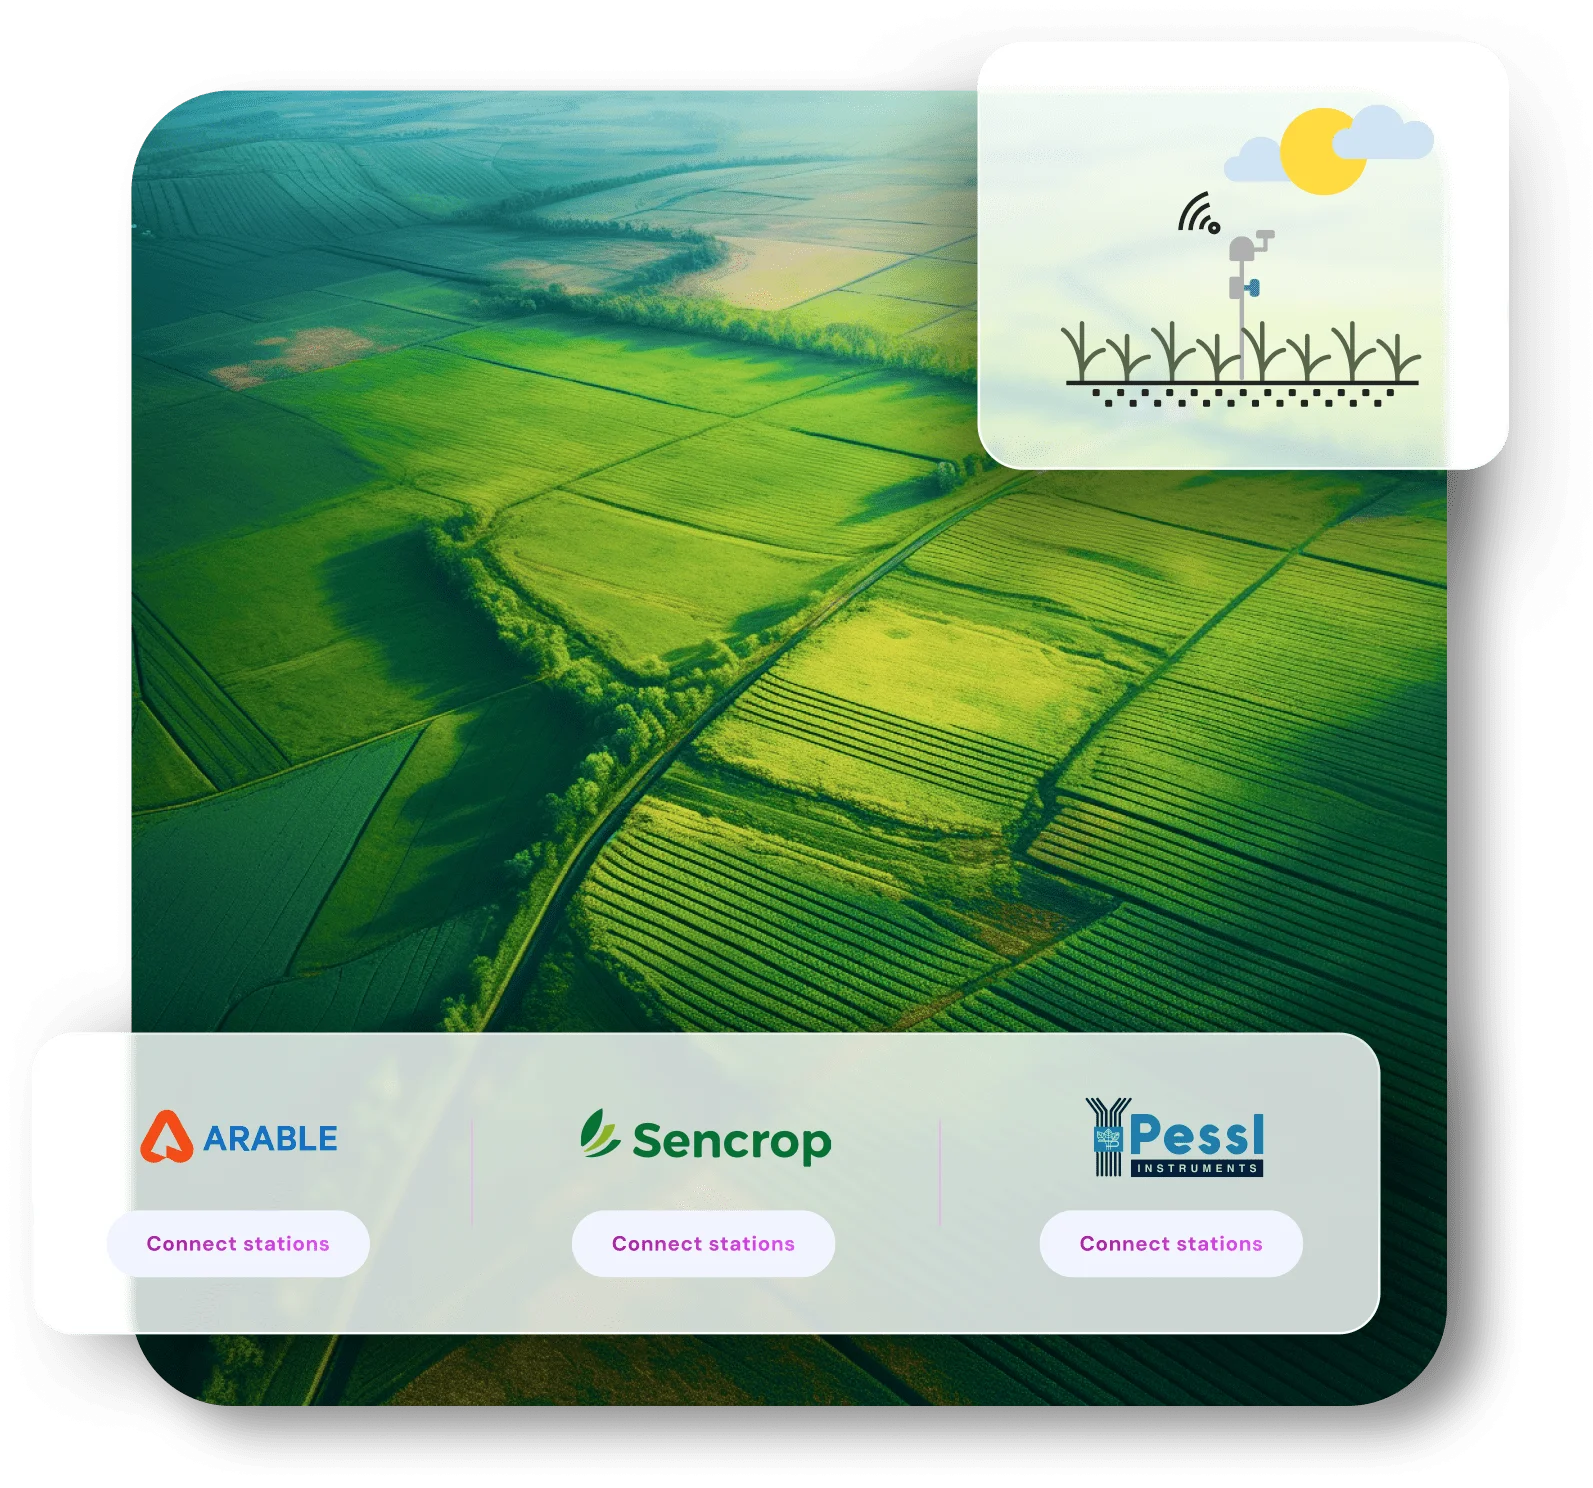
Connect your weather station withxarvio FIELD MANAGER
Get even more precise weather data and field analysis
- Visualize individual in-field weather data
- Receive real-time field weather updates
- Feed in-field data into xarvio's agronomic risk models for even better reccomendations