Maximize yields. Optimize costs.
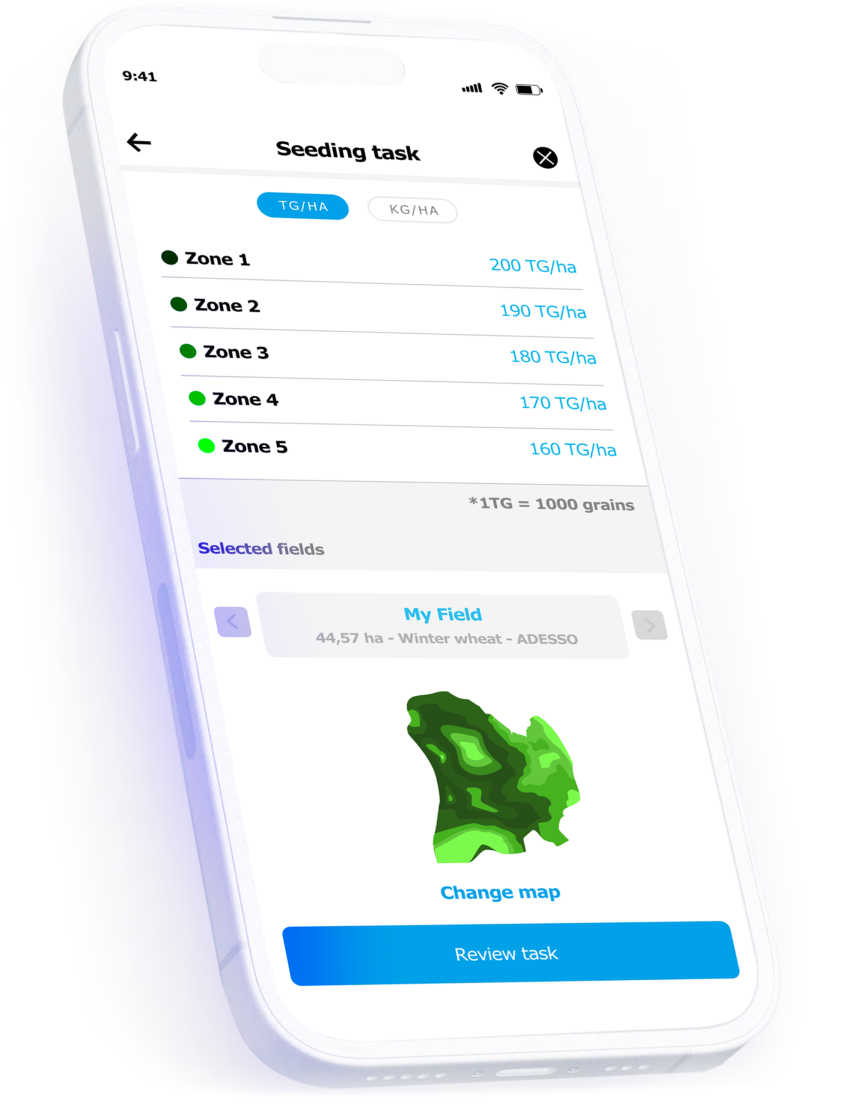
xarvio FIELD MANAGER helps you create expert level variable seeding maps in less than a minute, recommending precisely which variety to seed, in which zone, with the right density.
Variety recommendation:
Select most appropriate crop varieties for any specific field.
High number of varieties: for a specific region, there might be up to 100 varieties available.
Pest and Disease Pressure: Selecting resistant varieties for local pests and diseases using up-to date information.
Soil Conditions: Different seed varieties thrive in specific soil types.
Farmer Goals: Variety selection takes into consideration your goals of maximizing yield, reducing input costs, or practicing sustainable agriculture.
Market Demands: Some varieties may have higher market value or be in greater demand.
Performance: Assessing the historical performance of different varieties in the region so we can provide you with valuable insights.
Variable seeding maps:
Create expert level variable seeding maps in less than a minute
Automation due to the advanced algorithms
Advanced algorithms and machine learning can provide accurate variety and seeding rate recommendations.
Data complexity made easy
Mitigate data complexity by merging various maps and weighing their importance in the final map, resulting in creating a highly customized map.
Real-time adjustments of Seeding Rates in zones
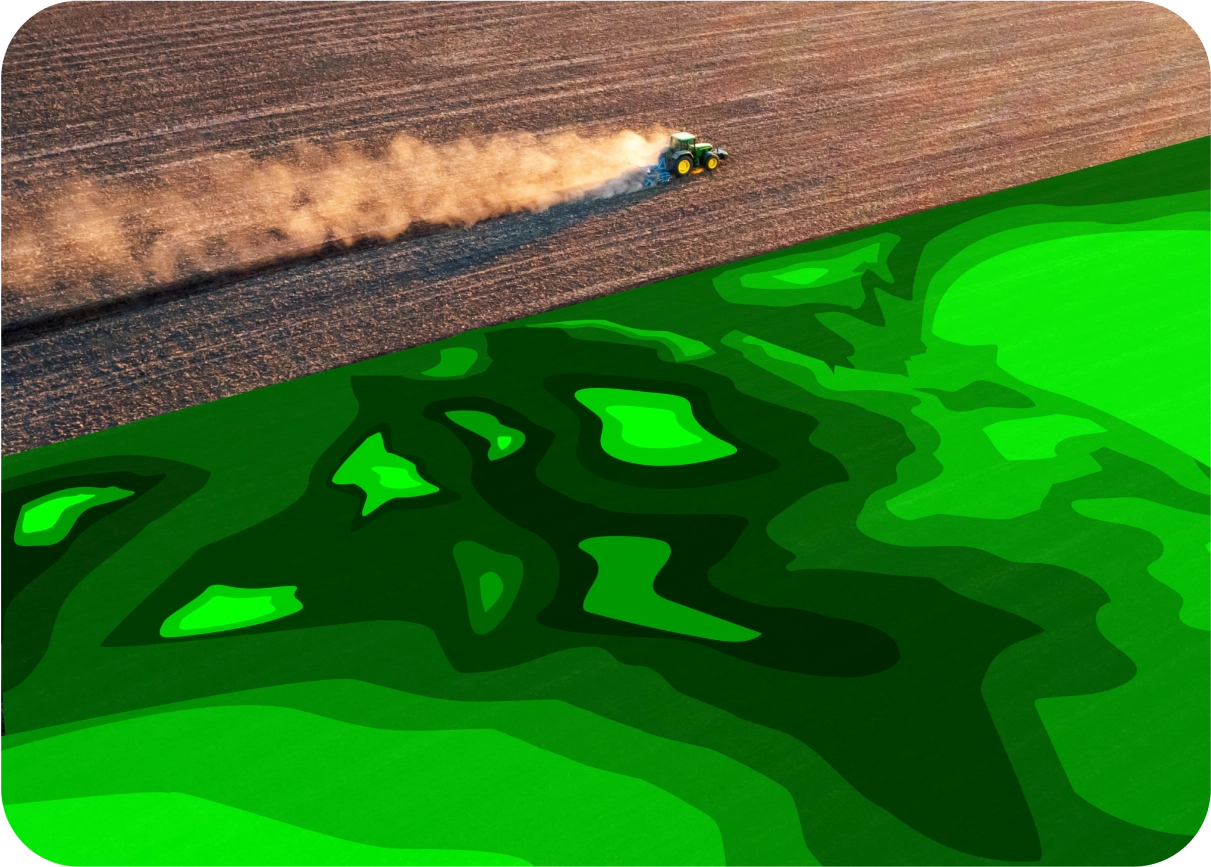
During seeding, the Variable Seeding Maps created in xarvio FIELD MANAGER and uploaded to the terminal are a time saver and increase the planting operation efficiency.
Data visualization understandable and actionable
Visualization of the seeding task makes complex data more understandable and actionable, aiding agronomists and operators to check on-the-flight the planting operation.
Remote access to the field
xarvio FIELD MANAGER allows remote access to the field data, enabling agronomists to create tasks from wherever they are.
Scalable to large farms
xarvio FIELD MANAGER can be used for large farms, in several states in a country, by advisors that attend customers in different regions, creating seeding tasks remotely.
The proof in practice
Trials show that using merged maps or powerzone maps outperform farmer’s standard practice every time and result in yield increase.

Increased yield 6,4% and higher ROI +48EUR/ha by fine-tuning seeding density between different zones. VRS always resulted in a better yield compared to fixed rate seeding.
Real intelligence,
Real results (Brazil trials 2020-2023):
Crop
Total Field TRIALS
Total Area (has.)
Yield Increase (%)
Return on Investment (€/ha)
Crop
Total Field TRIALS
Total Area (has.)
Yield Increase (%)
Return on Investment (€/ha)
Soybean
Soybean
44
5.718
3%
€59,29
Corn
Corn
38
5.356
5%
€35,00
Cotton
Cotton
16
2.757
6,4%
€48,00